Walk into a car dealership and ask "how much per mile does this cost to run?" The salesperson will have the number to hand. Walk into an estate agent and ask "what's the price per square foot in Queen's Park?" You'll get a pause, a throat-clearing, and a pivot towards "the feel of the area." Price per square foot is the one metric that allows genuine comparison. That's exactly why most agents don't bring it up.
Queen's Park is Zone 2. The Bakerloo line reaches Baker Street in eleven minutes. You're closer to the West End than most of Clapham, closer to Paddington than half of Bayswater. But property prices in NW6 behave as though you're in Zone 3.
Why? Name recognition. "West Hampstead" has the word "Hampstead" in it, which does about 60% of the work on its own. "Maida Vale" has Little Venice and a name that sounds like somewhere a retired diplomat might live. "Queen's Park" has a park, a station, and residential streets that are, by any objective measure, as good as either of those places. What it doesn't have is the brand premium.
The average house price in Queen's Park sits 15–25% below equivalents in West Hampstead and Maida Vale. Same zone. Same commute times. Same school catchments. Different name. That gap between substance and perception isn't a problem. It's an opportunity.
Price Per Square Foot: The Range, and What It Means
NW6 property prices aren't a single number. At the lower end (ex-council conversions on Kilburn Lane, flats above shops) you're looking at about £635 per square foot. At the upper end (lateral conversions in the Edwardian terraces between Chevening Road and Brondesbury Road) it stretches to £863. The median is about £740/sqft.
That number on its own tells you nothing. You need to know what the same square foot costs next door:
| Area | Postcode | Price/sqft (range) | Median | Zone |
|---|---|---|---|---|
| Maida Vale | W9 | £900 – £1,200 | £1,020 | 2 |
| West Hampstead | NW6 | £850 – £1,100 | £950 | 2 |
| Queen's Park | NW6 | £635 – £863 | £740 | 2 |
| Kensal Rise | NW10 | £600 – £800 | £690 | 2/3 |
| Kilburn | NW6 | £550 – £750 | £640 | 2 |
Queen's Park sits 22% below West Hampstead and 27% below Maida Vale. Same transport zone. In many cases, the same local authority. It sits comfortably above Kilburn and Kensal Rise, which makes geographical sense, as the park functions as an amenity anchor.
The Avenue, at £770 per square foot, is above the area median (you're not buying the cheapest stock) but materially below what neighbouring postcodes charge for equivalent space. A premium for quality, not for a postcode's vanity. (For a head-to-head breakdown with the other NW6 new-build, see The Avenue vs Queens Park Place.)
NW6 Property Market Trends: Steady Growth, No Headlines
Queen's Park property prices have grown 21.9% over five years and 19.2% over ten. Land Registry completed-sale data: actual transactions where money changed hands, not Rightmove asking prices or Zoopla estimates.
The Greater London average over the same five years is about 16.3%. Over ten, around 22.4%. So Queen's Park has outperformed London over five years while slightly trailing over ten. The area has been catching up, quietly, without a press release.
Consider what happens to areas that "surge." Hackney Wick: 42% growth between 2014 and 2019, then a 12% correction. Nine Elms: 35% on paper during the development boom, then resale prices that in 2026 still sit below their 2017 peaks in several blocks. Speculative surges create fragile prices. Steady demand creates durable ones.
The NW6 property market doesn't make headlines. It grows at roughly 4% per annum compounded, in an area where underlying demand (young professionals, families trading up from Kilburn, international renters near the Jubilee line) shows no sign of evaporating.
March 2026 Market Snapshot
The latest Rightmove data, updated February 2026, puts the average property price in Queen's Park at £991,240. That's the all-types average across flats, terraces, and semis. Dig into the property types and the picture gets more interesting:
| Property Type | Average Price | Annual Change |
|---|---|---|
| Flats & apartments | £582,529 | Moderate growth |
| Terraced houses | £1,312,492 | Steady |
| Semi-detached houses | £2,432,142 | +26.35% |
That semi-detached figure is the standout. A 26% annual increase in a single property type suggests a supply squeeze: when a semi-detached house comes to market in Queen's Park, it rarely hangs around. There are only so many of them, mostly concentrated between the park and Brondesbury Road, and the kind of family willing to spend £2.4 million on one tends to have the resources to move quickly.
Flats account for 51.5% of all sales in the area. That matters if you're buying an apartment: half the market is your segment, which means more comparable data, more transaction evidence for mortgage valuers, and more liquidity when you come to sell.
One new development to be aware of: Queens Park Place at 35 Salusbury Road. New-build, two-bedroom apartments from £700,000. Good quality, but at that price you're comparing 812 square feet at Salusbury Road against 1,753 square feet at The Avenue. Same postcode. Less than half the space. Different buildings answer different questions, but the maths is worth doing yourself.
Flats account for 51.5% of all Queen's Park sales. Half the market is your segment, which means more comparable data, more liquidity when you sell.
What £1.35 Million Gets You in Four Postcodes
£1.35 million is a lot of money. But in London property, the difference between postcodes at this price point is striking. So here's a comparison that estate agents almost never make.
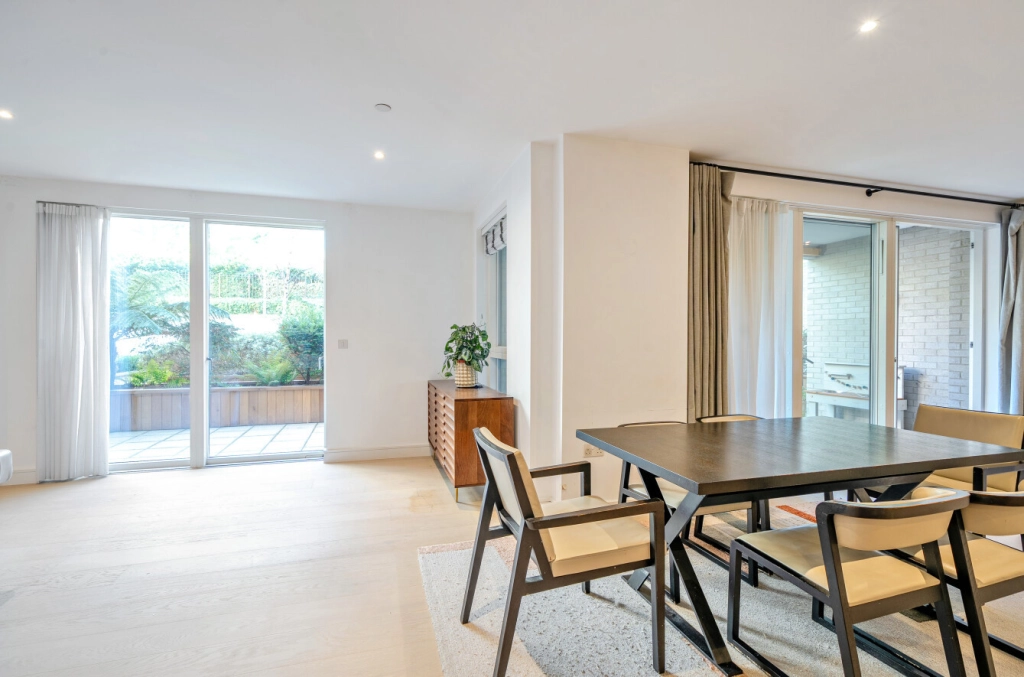
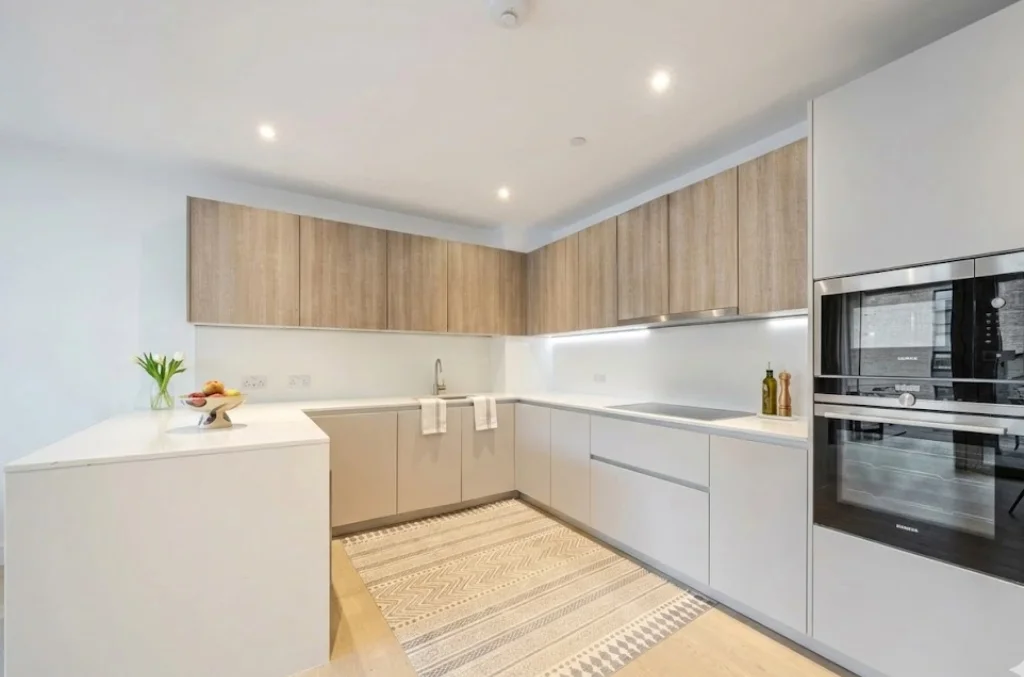
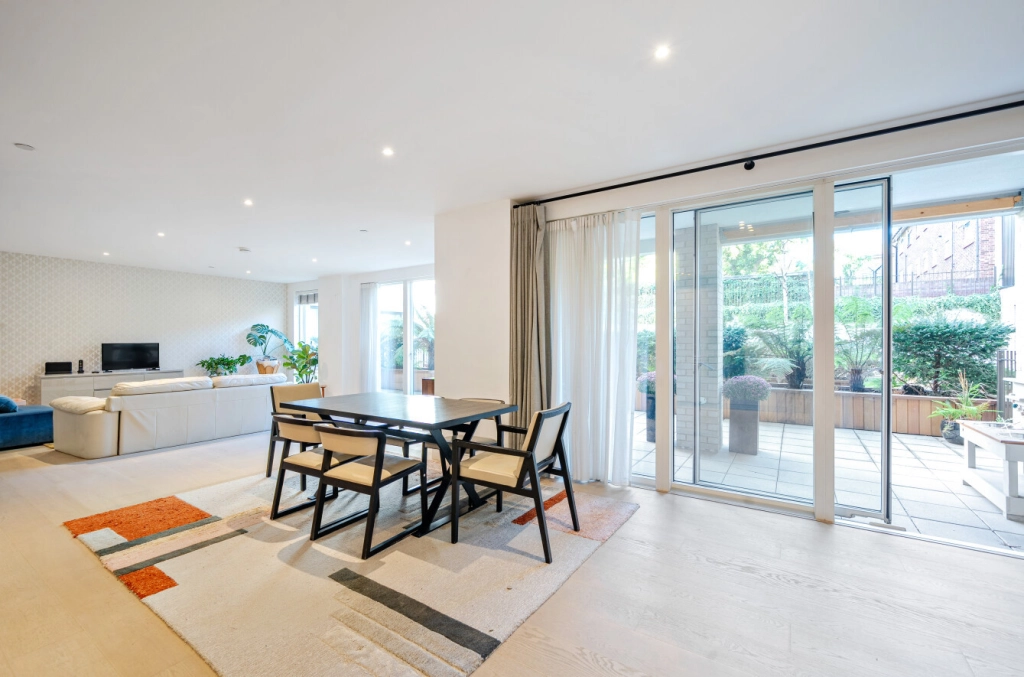
In Queen's Park (The Avenue): 1,753 square feet. Three bedrooms, each fitting a king-size bed and freestanding furniture. Three bathrooms. A kitchen-living space that runs to 40 feet. Two terraces totalling 380 square feet. Allocated parking. A lift. Modern build, no chain.
In West Hampstead: About 1,100–1,300 square feet in a Victorian conversion. Two bedrooms. One bathroom, maybe a shower room. A galley kitchen the listing calls "efficient." No parking. Possibly a shared garden you'll use three times a year. A boiler that predates your first mobile phone.
In Maida Vale: Roughly 1,100 square feet. Two bedrooms in a mansion block. A lease that may have dipped below 90 years. A service charge that's risen 18% in three years. The ceilings are high. But you'll eat dinner in a "dining area" that's actually the wide end of the hallway.
In Notting Hill: A one-bedroom flat, if you move quickly and negotiate hard. The median price for a one-bed in W11 is £1.1 million. Your "garden view" is a lightwell shared with the building's bins. But you can tell people you live in Notting Hill, and for some buyers that sentence is worth £400,000.
The Queen's Park price per sqft advantage isn't a rounding error. It's a 35–45% space premium over comparable neighbours. At this budget, that translates to an extra bedroom, an extra bathroom, and outdoor space that actually exists. Complete specification and cost breakdown for this property: full property details →
38.4% of Queen's Park Rents
More than a third of households in Queen's Park are privately rented. That's not a statistic about character. It's a statement about your exit strategy.
A three-bedroom flat here currently commands £2,800 to £3,200 per month. At the upper end, which a property with parking, terraces, and three bathrooms would comfortably achieve, that's about £38,400 per year. Against £1.35 million, a gross yield of 2.84%.
That yield won't make you rich. But it gives you options. If you need to relocate, you don't have to sell into a slow market. If rates shift and you want to wait out a cycle, the rental income covers a meaningful portion of the mortgage. Tenant demand in NW6 is structural, driven by professionals who work in central London and want a Zone 2 commute. That pool isn't shrinking.
Strong rental demand isn't an investment thesis. It's insurance. You're buying a home. But if circumstances change, it works as an asset too.
The Honest Take
If everything so far has sounded positive, your scepticism is well-placed. Here's what to think about before writing a seven-figure cheque.
Interest rate sensitivity. With a 25% deposit on £1.35 million, you're borrowing north of £1 million. Every 0.5% rate movement means roughly £250–£300 per month. As of early 2026, the Bank of England base rate is 4.5% and five-year fixes sit between 4.1% and 4.6%. If rates stay elevated, or rise, that affects your monthly cost and the pool of buyers when you sell. Price this in.
Service charges. New-build flats carry annual charges of £3,500 to £6,500 depending on amenities and management. That adds 0.3–0.5% to your annual expenditure. Ask for three years of accounts before committing. If the freeholder won't provide them, that's a signal.
Lease length. Leasehold flats with fewer than 85 years remaining start losing value. Lenders get nervous below 70. Check the lease. Check it again. The Leasehold and Freehold Reform Act 2024 has improved the extension framework, but the process isn't instant or free.
These caveats aren't unique to Queen's Park; they apply to virtually every leasehold flat in London. But you should hear them from the people selling the property, not from your solicitor three weeks into conveyancing.